MIPS Lab Environment Reference

Georg Fischer / e93gf@efd.lth.se


The Simulator

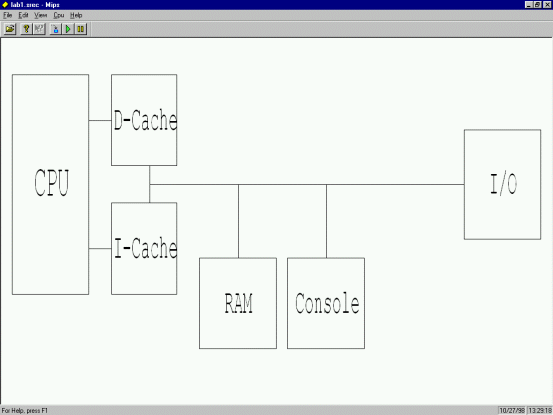
The simulator (MIPS.EXE) provides you with the possibility to run programs.

Figure 1-2.
The simulator.

The main view (Figure 1-2) consists of 6 units, CPU, RAM, Console, I/O, D-Cache and I-Cache. When you click on a unit a window will appear (or disappear if it is already open). There is also an interrupt unit available from the View menu. Here follows a brief description of each unit’s window:

CPU
View/modify the CPU registers.

RAM
View/modify memory, also referred to as the MemView. This unit has most functions of all, for a more detailed description see below.

Console
Standard input/output for programs that use it.

I/O
Simulates the 8-bit I/O unit, with 8 switches and 8 LEDs.

D-Cache/I-Cache
Views of the data and instruction caches.

Interrupt
Simulates the interrupt unit, with buttons K1, K2 and the timer.

Figure 1-3.
The MemView.

The MemView is a list over the complete 32-bit address space (4GB). Each line is one word-aligned address, 0, 4, 8 and so on. The content of each line is displayed as four bytes in hexadecimal and some form of "translation" of the content (by default assembler). Since, of course, there is not 4GB of memory available and there is no point in allocating memory that is not used, most of the memory will be non-allocated. The non-allocated memory is displayed with a gray color and its content will be filled with question marks (?? ?? ?? ??). This is not anything you have to worry about, it is just to explain why most of the memory contains question marks. Addresses can be displayed in two modes, virtual and physical mode. Usually only virtual mode is of interest. Physical mode has restrictions in the MemView and is not normally useful.

Most of the functions of the MemView can be accessed via the pop-up (Figure 1-4). To view the pop-up, click the right button in the MemView. In the first section you can select the address mode. The second section allows you to choose the translation of the content. The third section is related to the current position of the MemView. You can toggle Track PC. If Track PC is enabled the view will always keep the address pointed to by the PC in the center. At bottom right of the status bar you can see if tracking is enabled or not (see Figure 1-3). You can also only Jump to PC, this will center the current address of the PC but it will not track it. Jump to SP does the same as Jump to PC but it jumps to the address pointed to by the stack pointer (register 29). If any symbols are loaded you can also jump to a symbol. When you do this a list of symbols will be displayed for you to choose from. In the fourth and last section of the pop-up you can Set Next Statement and Set/Clear Breakpoint. Set Next Statement will set the value of the PC to the address you clicked on when opening the pop-up. The address will have a focus-rectangle around it. Set Breakpoint/Clear Breakpoint will set or remove a breakpoint at the focused address.

Figure 1-4.
The MemView pop-up.

You can also toggle breakpoints by double clicking on an address in the MemView. Breakpoints are displayed as dots in the left column (see Figure 1-3). The left column may also contain vertical blue or red lines with smaller dots on them. These line indicates if an address is cached. Red lines if it is in the instruction cache, blue lines if it is in the data cache. This is purely for informational purposes and can be ignored.

To jump to a certain address just click in the Address column of the view. Using the scrollbar will be fairly difficult considering that it covers the whole address space. After entering the address press <ENTER>, or <ESC> if you wish to return to the old address. To edit the contents of an address click the Content column and enter the data. Press <ENTER> to accept the new value or <ESC> to keep the old value.

To load a program into the simulator it is recommended to use the "Upload To Simulator" function in MipsIt. It is possible to load programs from the simulator. To do this, choose Open from the File menu. There are two different file types that can be loaded, .SREC and .OUT files. Note that SREC files contain no symbolic information. After a program is loaded you run it or step through it instruction by instruction. To run it at "full speed" choose Run from the Cpu menu. To step one instruction choose Step from the Cpu menu.

Cache

The cache views show the contents of the caches as well as some statistics. There is one view for each cache, data and instruction. Figure 1-5 below shows the data cache.

Figure 1-5.
Data Cache view.

The view contains four parts, current address, the cache, an optional write buffer and cache statistics. If the write buffer size is 0 no write buffer will be display. The address displayed is conveniently divided into tag, index and word fields. Depending on the cache configuration the field sizes will vary. The active row, selected by the index field, is marked gray. The active word, selected by the word field, is marked with blue text. The V column is the valid flag for a block. For a write back cache there will also be a dirty flag (D) column.

Figure 1-6.
Data Cache config.

To configure the caches go to the Edit menu and select Cache/Mem Config. The configuration dialog has three tabs, Inst. Cache, Data Cache and Memory. Inst. and Data are almost identical, the only difference is that the instruction cache has no write policy. Figure 1-6 shows the Data Cache config. In order to completely disable one of the caches check the Disable box. To just disable the penalty for a cache miss check the Disable penalty box. Sizes have to be of the magnitude 2n.

Figure 1-7.
Memory config.

If penalty is not disabled the penalty for memory reads and writes (in clock cycles) can be set in the Memory config (Figure 1-7). Here you can also change the size of the write buffer. The size is the number of rows in the buffer.

Figure 1-8.
Data Cache statistics.

Since the cache views give a performance hit in execution speed there is another option to view cache statistics while running long programs. The data and instruction caches each have a statistics window (Figure 1-8) that can be accessed from the View menu, I-Cache Stats and D-Cache Stats. It shows the current hit ratio, the overall hit ratio and the number of cycles executed.

Pipeline

The pipeline simulator consists of a shell program named Mipspipe2000.exe that loads java scripts with structural information of the pipeline. There are two different scripts that contains different pipeline views of the CPU. One has a simpler pipeline model and is called \S-script\s.dit. The other one has a more complex pipeline, \Xl-script\xl.dit. The small pipeline has no forwarding or hazard detection. The XL version has those features and controller units that can be modified by the user. The controllers are programmed with a java script.

There are a number of predefined variables that correspond to in/out signals to/from the controller.

Expression syntax:

var = x ;    Assigns x to variable var
x ::=
x & xBitwise AND
x | xBitwise OR
x ^ xBitwise XOR
~xBitwise complement
x << xLogical shift left
x >> xLogical shift right
x == xBoolean equal
x != xBoolean not equal
!xBoolean NOT
(x)Encloses a sub-expression. Operator priorities might not be as expected, use this often.
var[x]Bit extraction, returns bit x from variable var
constantNumeric constant, for hex use 0x-prefix

An example to demonstrate the syntax (note that this does not really do anything useful):
	tmp = (Op & 0xaa) >> 3 ;
	ALUSrc = !((tmp ^ 0xf0) == 0x05) ;

To open a controller dialog (Figure 1-8) choose from the edit menu the desired controller unit to view. The available units are Control and Forward.

Figure 1-8.
Pipeline controller.

To enable the user defined controller script, make sure the Use this script check box is checked. When the ok button is pressed the script will be compiled and any errors will be displayed in a new dialog box along with the line and char number.

Remember to save your script after big changes. Software can crash, and all work will be lost.

MipsIt Studio2000 and the Build Process

MipsIt Studio is a Windows-hosted integrated development environment (IDE) for the IDT MIPS cards (and simulator). Figure 2-1 shows the IDE in action.

Figure 2-1.
MipsIt Studio2000.

If you have used Microsoft Developer Studio/Visual C++, you should have a pretty good idea how MipsIt works. But if you are new to IDEs, you need to know what a project is. A project is a collection of interrelated source files that are compiled and linked to make up an executable file that can be uploaded to the simulator or to the MIPS hardware. A project may also include text files. These are only for informational purposes.

IDE Basics

The IDE consists of the following windows (see Figure 2-1):

Many commands also have hotkeys (like most Windows programs) to make work more efficient. There is also a toolbar with some of the commands. Some commands are disabled at all times. These are currently non-implemented.

To configure the IDE, choose Options from the File menu. You can change COM settings, compiler executable, paths etc. When you start MipsIt the first time it will normally auto-configure correctly except for the COM-port. After changing any COM settings MipsIt needs to be restarted.

Creating a Project

To create a new project follow these steps:

  1. Choose New from the File menu, and then click the Project tab (if it is not already selected) in the resulting New dialog box shown in Figure 2-2 below.

  2. Select the type of project you want to create from the list. The project types are as follows:

    Assembler - If your project will only contain assembler files.

    C/Assembler - If you want a project that will contain only C or C and assembler files.

    C(minimal)/Assembler – Same as C/Assembler except with minimal libraries. This is your normal choice if you want a project that contains C files.

    The difference between the project types are the default libraries and modules. A C/Assembler project will link with a couple of libraries and will result in a bigger executable (which won’t work with the simulator). A C(minimal)/Assembler project will link with only the absolute necessary libraries and will result in a smaller executable than with C/Assembler (which will work with the simulator).

  3. Enter a name for the project and change the location if desired, and then click OK.

Figure 2-2.
The New dialog, Project tab.

Adding Files to a Project

If you followed the steps for creating a new project you should now have an empty project. You can now add files to it by either creating new files or adding existing files. Creating a new file is very similar to creating a new project, except you select the File tab (see Figure 2-3) instead of the Project tab in the New dialog. If you want to add an existing file choose Add File from the Project menu, and then select the file you want to add.

Figure 2-3.
The New dialog, File tab.

Building and Uploading

In order to build your project choose Build from the Build menu. Any files that needs compilation will be compiled (or assembled) and finally the executable will be linked. Current status and results of the build process can be seen in the output window (see Figure 2-1). When the project has been successfully built you can now upload the executable to the simulator or to the MIPS board by selecting Upload To Hardware or To Simulator in the Build menu.

In case you want to re-compile all files, even those that have not been modified since last build, choose Rebuild All from the Build menu.

NOTE: In order to successfully upload to hardware the MIPS board must be "ready", i.e. connected to the computer, switched on and not running any program. The easiest way to make sure if the board is ready is to press <ENTER> in the console, when you should get a <IDT> prompt. To reset the MIPS board press <CTRL>+<BREAK>. If that does not work press the reset button on the board. When nothing happens after pressing the reset button check that the COM settings are correct (choose Options in the File menu) and make sure the board is correctly connected to the computer and the power is turned on.

Viewing Assembler from C

It is possible to see the assembler code generated by the compiler from a C source file. To do this open the C file (make sure it is the active window) and choose View Assembler from the Build menu. When successfully compiled an assembler window will open with the output. The assembler output is not saved in any file.


Edited by
Tobias Harms Department of Information Technology.
Anders Ardo, 2009-08-17, Department of Electrical and Information Technology